The Prometheus community developed JMX Exporter to export JVM monitoring metrics so that Prometheus can be used to collect monitoring data.When your Java application is deployed on Rainbond
Learn how Java applications deployed on Rainbond can use the JMX Exporter to expose JVM monitoring metrics. :::
Introduction to JMX Exporter
Java Management Extensions, JMX is an extension framework for managing Java, JMX Exporter reads the runtime state of the JVM based on this framework.JMX Exporter uses Java's JMX mechanism to read the monitoring data of the JVM runtime, and then converts it into a metrics format that can be recognized by Prometheus, so that Prometheus can monitor and collect it.
JMX Exporter provides start independent process and JVM in-process start (in:process)two ways to expose JVM monitoring indicators4
Start independent process
The parameters are specified when the JVM starts, and the RMI interface of JMX is exposed.JMX Exporter calls RMI to obtain JVM runtime status data, converts it to Prometheus metrics format, and exposes ports for Prometheus to collect.
JVM in-process start (in-process)
Specify parameters when the JVM starts, run the JMX Exporter jar package in the form of javaagent, read the JVM runtime status data in the process, convert it to the Prometheus metrics format, and expose the port for Prometheus to collect.
Officially, it is not recommended to use
to start an independent processThis method is complicated to configure and requires a separate process, and the monitoring of the process itself has caused new problems.This article takes theJVM in-process (in-process)method as an example, and uses the JMX Exporter in Rainbond to expose the JVM monitoring indicators.
Using the JMX Exporter on Rainbond
OnRainbond, components with different build types are handled differently, as follows
Java applications built from source
JAVA applications built from Rainbond source code since V5.3 will be packaged with JMX Exporter by default, and users only need to add environment variables to enable them.
Add a specified environment variable
ES_ENABLE_JMX_EXPORTER = truefor the JAVA service component to enablejmx_exporter.Add a port
5556to the port management of the JAVA service component, which is the default port that jmx_exporter listens on.
Java applications built from images
For mirrored or market-built apps, you can inject jmx_agentusing an initialization type of plugin.
The implementation principle has been explained in detail in previous articles. You can refer to:Rainbond integrates SkyWalking through plug-ins to realize APM plug-and-play Agent plug-in implementation principle part.
- Build the jmx_exporter plugin
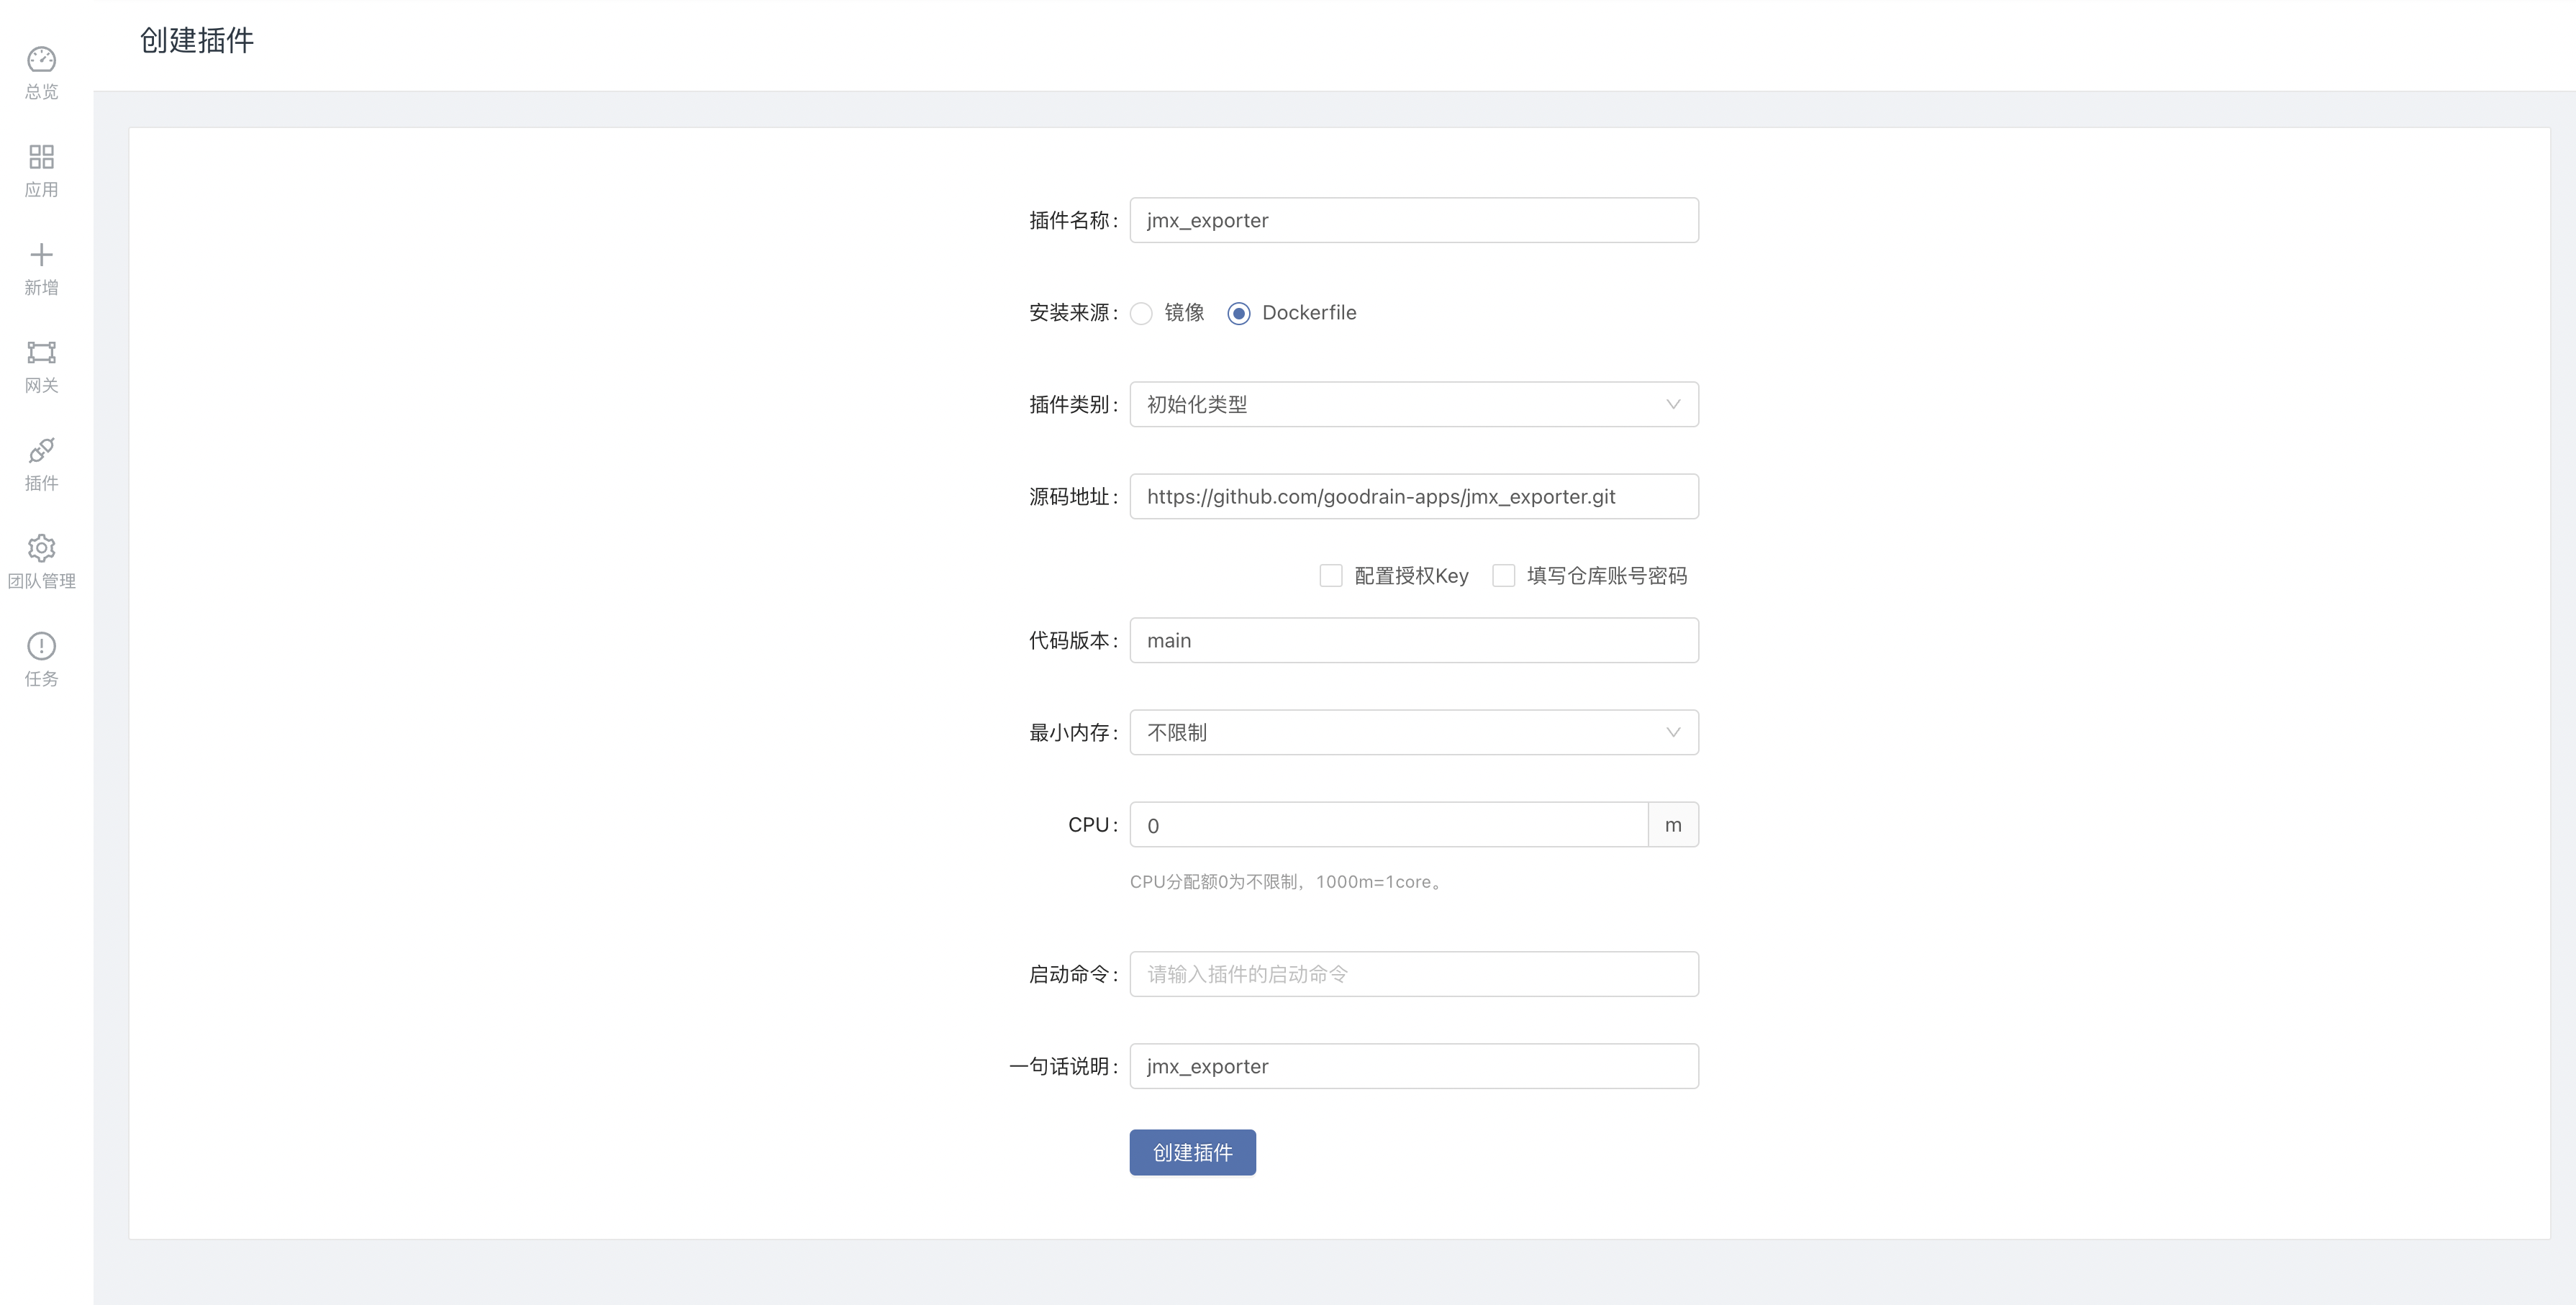
Enter the team -> plugins -> create a new plugin, create an initialization type plugin, source address:https://github.com/goodrain-apps/jmx_exporter.git

After the plug-in is successfully constructed, it can be used, and this plug-in can be activated for the JAVA service component.
- mount storage
Mount storage /tmp/agentfor the JAVA service component so that it can share storage with plugins.
Through the shared storage, the initialization plug-in puts the required configuration files and Agent in the shared storage for the main service to use, so as to realize the service without intrusion.
- add environment variable
Add environment variable for JAVA service component JAVA_OPTS = -javaagent:/tmp/agent/jmx_prometheus_javaagent-0.16.1.jar=5556:/tmp/agent/prometheus-jmx-config.yaml
The mountable configuration file /tmp/agent/prometheus-jmx-config.yaml replaces the existing configuration file.
- add port
In the port management of the component, add a new port 5556
The last update component will take effect.
Add application monitoring point
Application monitoring is based on rbd-monitor When we add monitoring points, it is equivalent to creating a servicemonitor.
Enter the component -> monitoring -> business monitoring -> management monitoring point, add monitoring point, fill in the following information:
Configuration name:custom
Collect task name:custom
Collection interval:10 seconds
Metrics path:/metrics
Port number:select
jmx_exporterport
After adding, update the component to make it take effect.
Add monitoring chart
Next, you can add a monitoring chart to display the JVM indicator line:in the JAVA service component
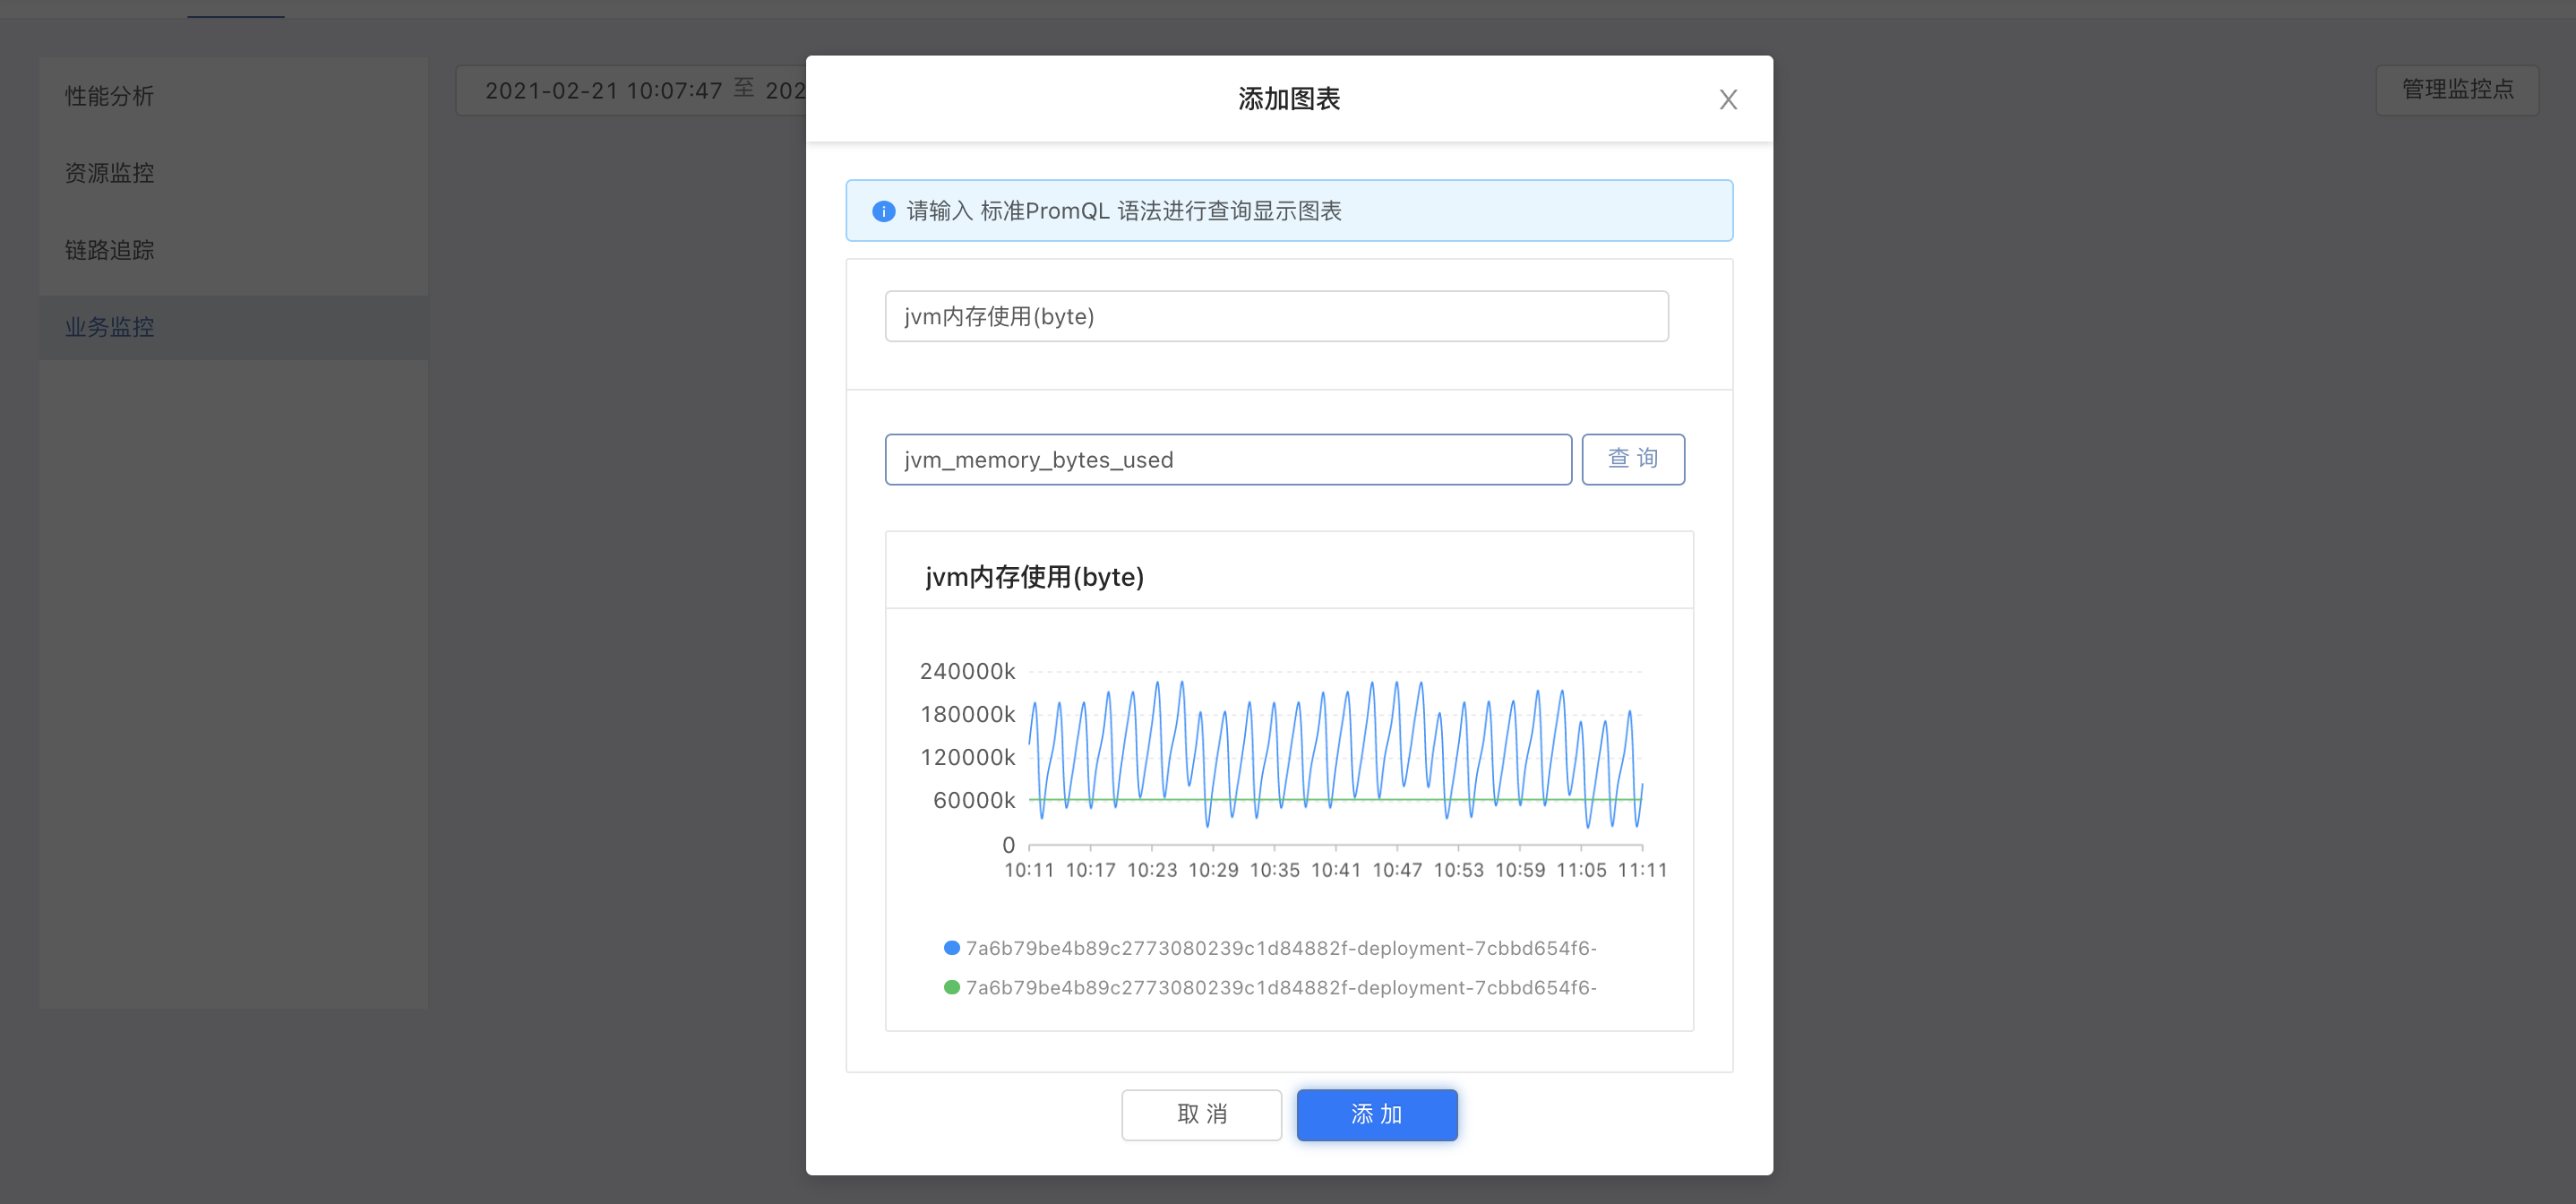
Click above the business monitoring panel to add chart
After entering a new title and the corresponding query condition jvm_memory_bytes_used , click to query.If the chart is returned normally, the query conditions are correct.The definition of the title should be as clear and concise as possible, and the unit should be specified where necessary.
For more indicators, please refer to official document

Extending Grafana
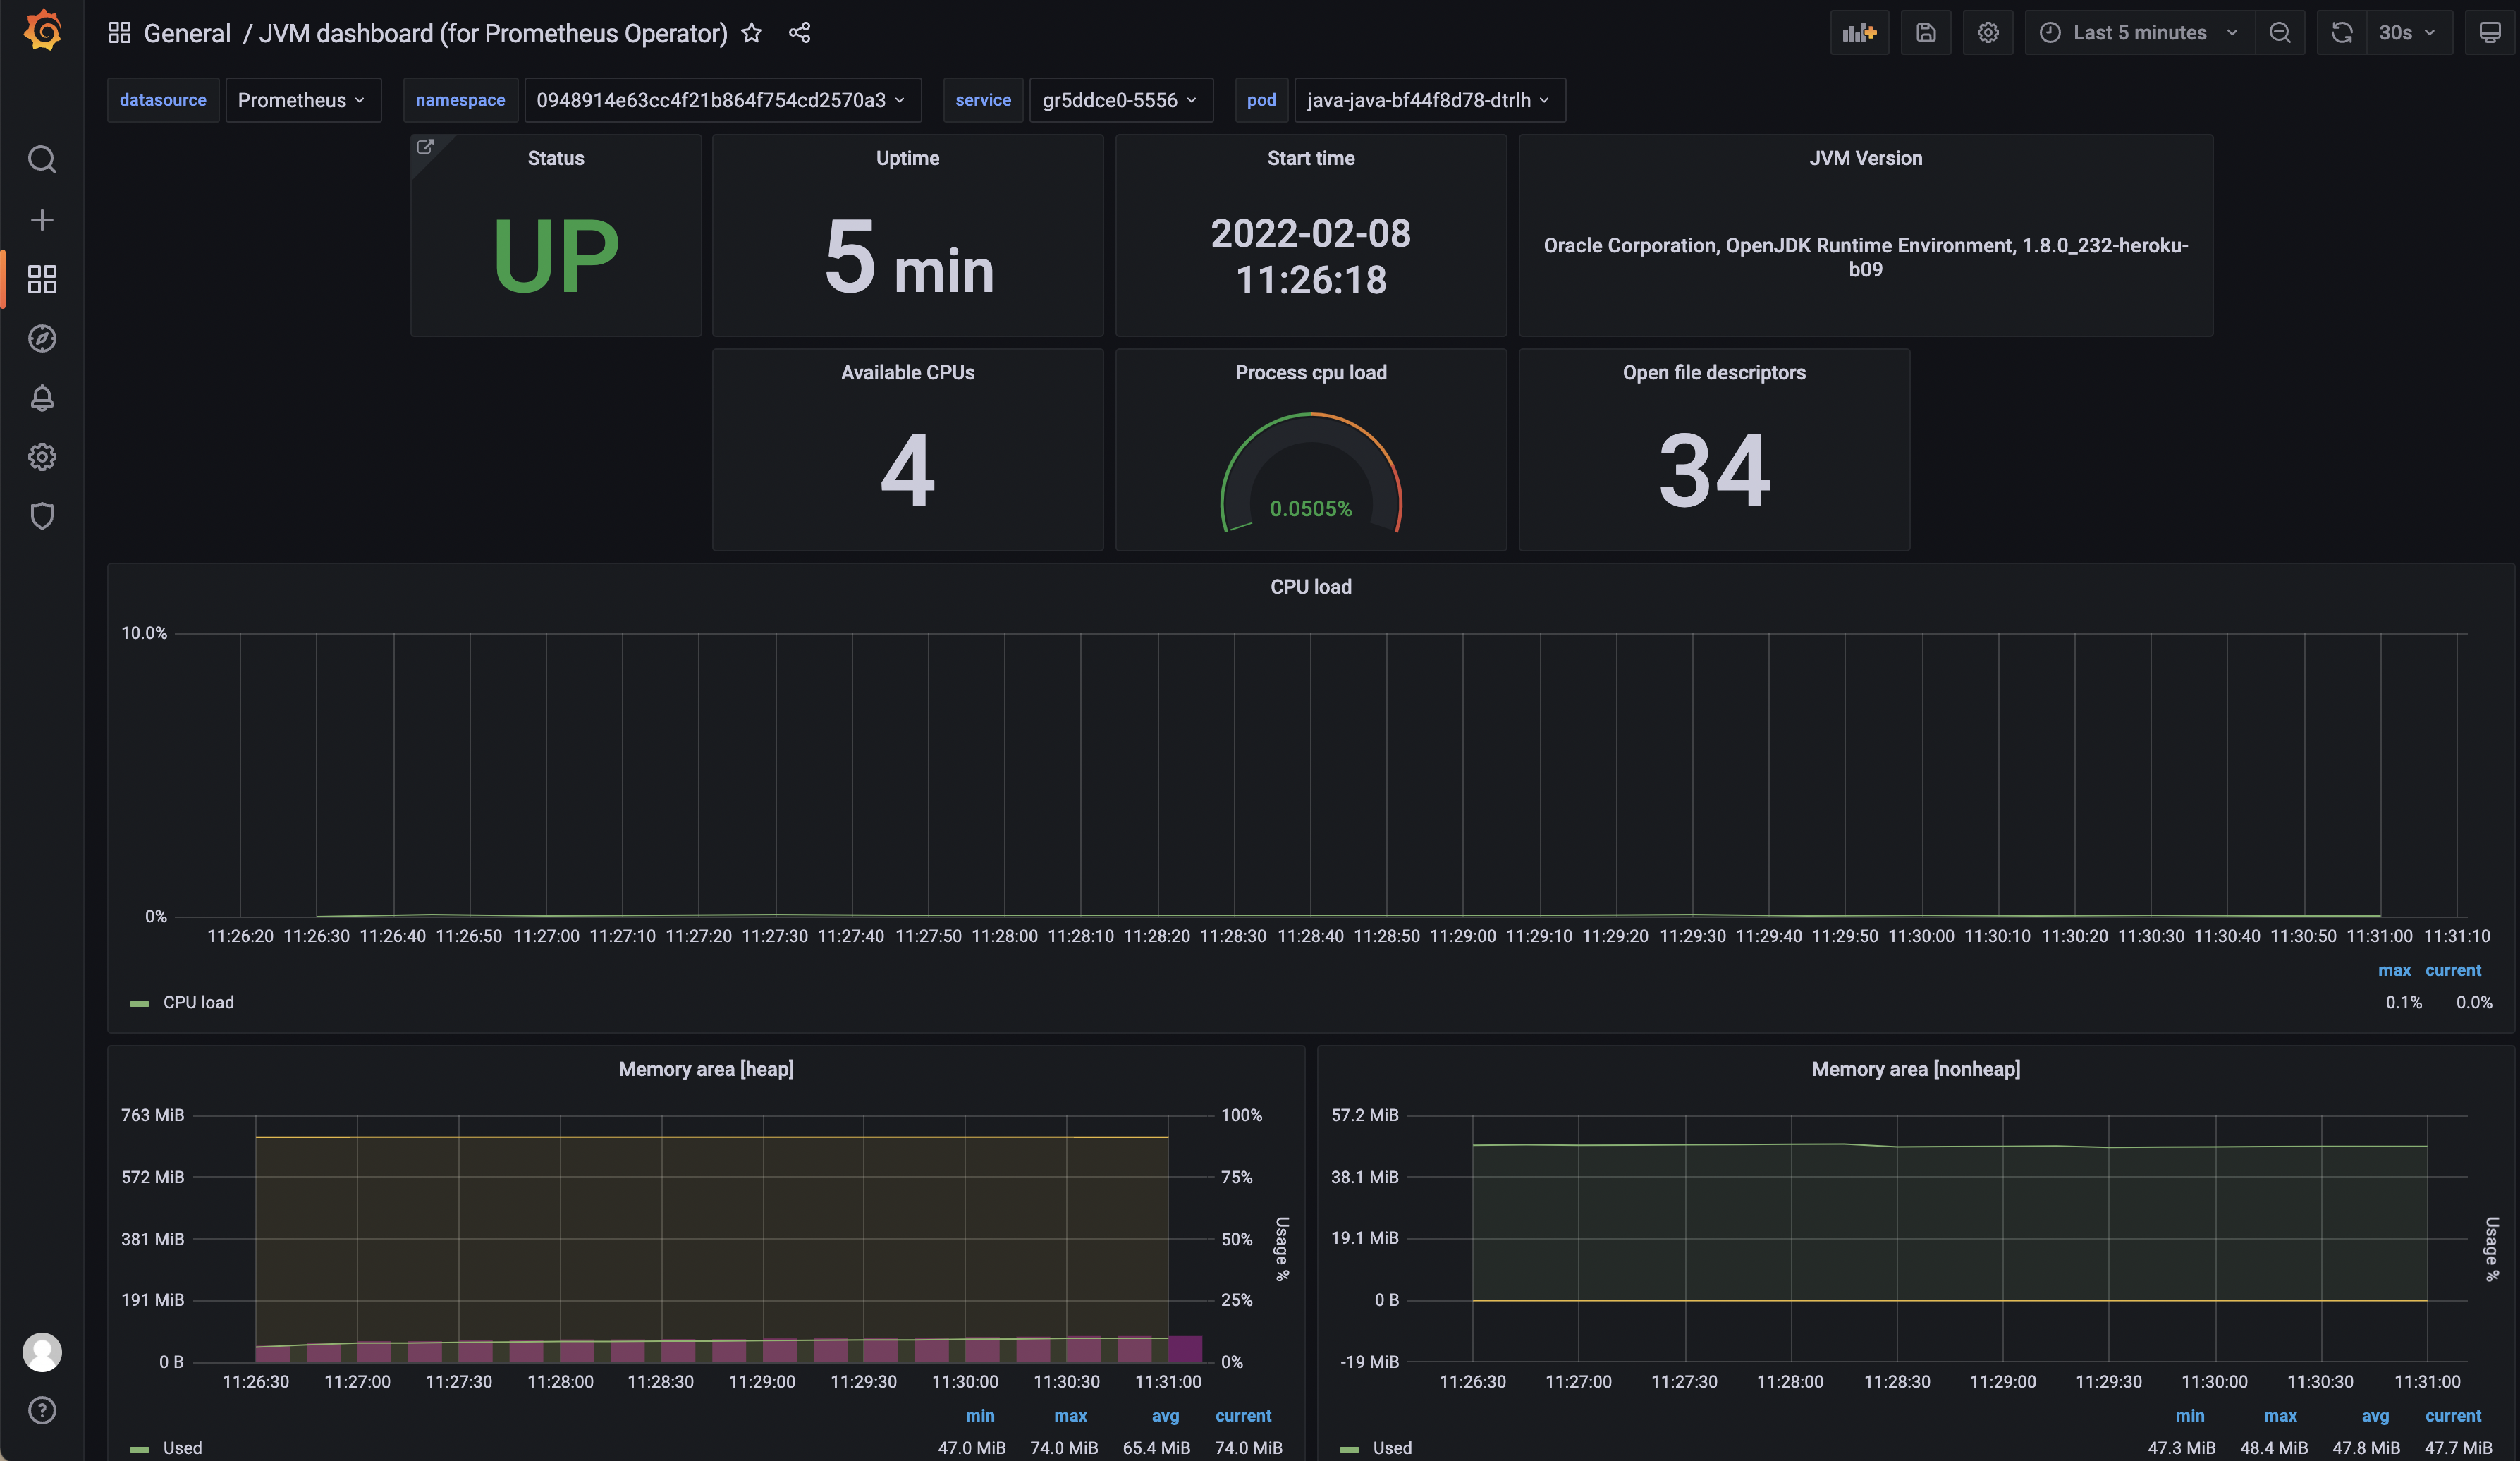
It can be displayed throughgrafana , the following briefly describes the operation steps:
- GET
rbd-monitorSERVICECLUSTER IP.
$ kubectl get svc -l name=rbd-monitor -n rbd-system

NAME TYPE CLUSTER-IP EXTERNAL-IP PORT(S) AGE
rbd-monitor ClusterIP 10.43.112.131   <none>        9999/TCP 13d
- Add third-party services on the platform, fill in
rbd-monitorserviceCLUSTER IP. - Install
Grafanafrom the open source app store and add dependencies. - Enter Grafana, Configuration -> Add Data Source -> URL is
http://127.0.0.1:9999, import JVM dashboard ID 8878 , and display application monitoring information through the Grafana panel.

References Link
jmx_export plugin Github https://github.com/goodrain-apps/jmx_exporter.git
jmx_export official https://github.com/prometheus/jmx_exporter.git
jvm dashboard https://grafana.com/grafana/dashboards/8878