Locust is an easy-to-use, scriptable and extensible performance testing tool.And there is a user-friendly web interface that displays test progress in real time.The load can even be changed while the test is running.It can also run without UI, making it easy to use for CI/CD testing.
Locust makes it easy to run load tests that are distributed across multiple machines.Locust is based on events (gevent), so it can support thousands of concurrent users on a single computer.In contrast to many other event-based applications, it does not use callbacks.Instead, it uses lightweight processes via gevent.Each Locust (locust) concurrently accessing the site is actually running in its own process (Greenlet).This allows users to write very expressive scenarios in Python without having to use callbacks or other mechanisms. :::
Rapid deployment of Locust
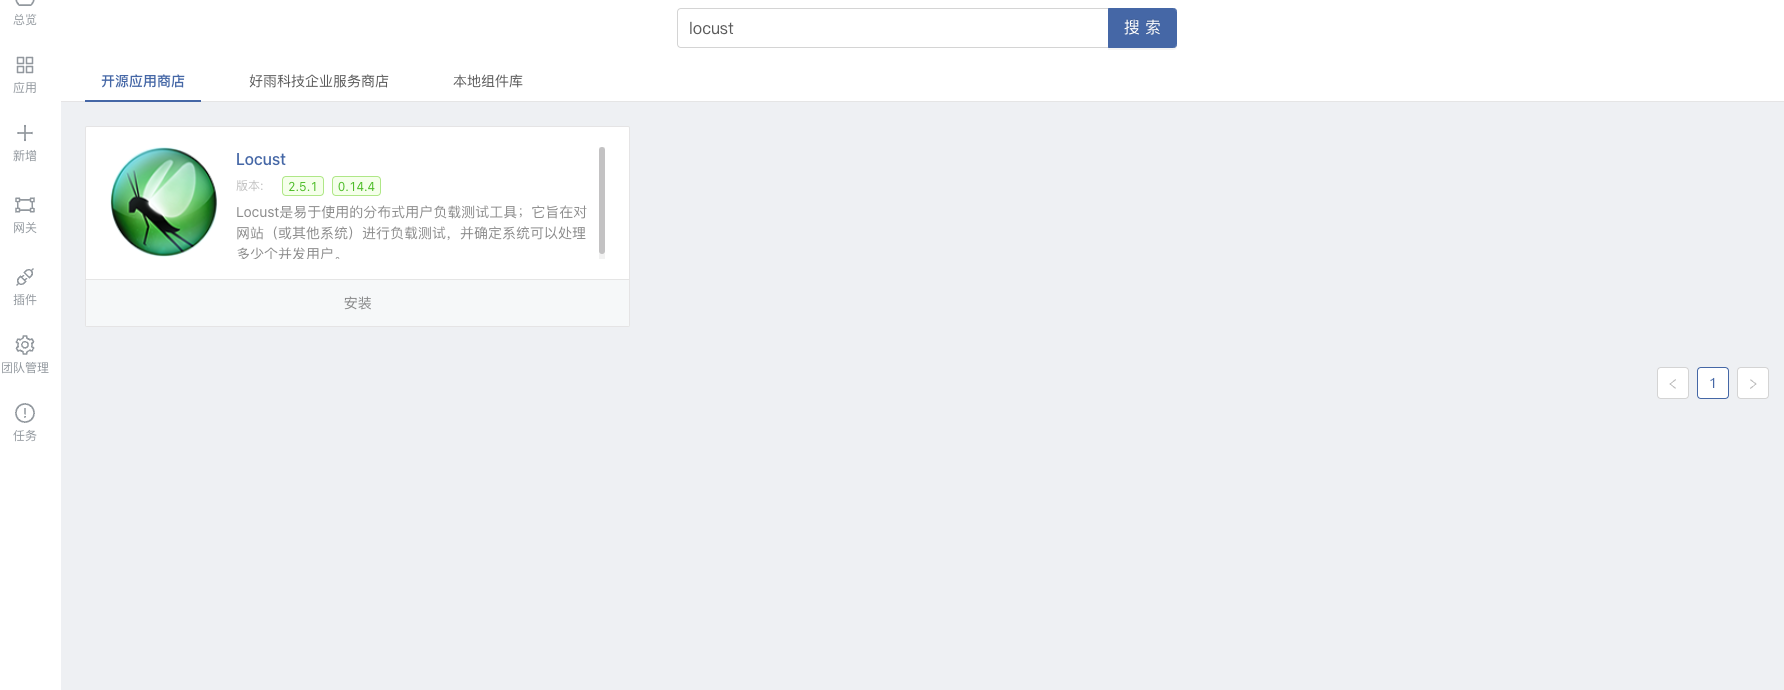
Locust application has been released to open source app store, search locust and install the latest2.5.1version.
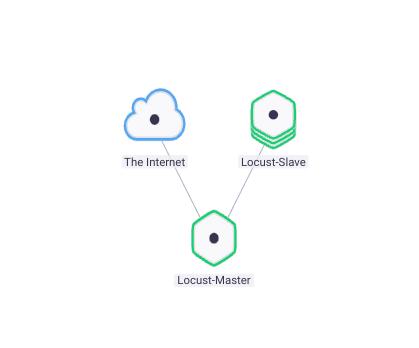
After the installation is complete, you will get a Locust master-slave cluster, in which the master component is responsible for providing the UI interface and scheduling concurrent tasks; the slave component is responsible for executing concurrent tasks, and the slave component also supports horizontal scaling. When the generated test concurrency reaches a certain level When the limit is reached, you only need to expand the instance of the slave component, such as:
how to use
Locust_Master provides a graphical management interface based on WEB-UI. When you log in for the first time, you will be prompted to enter some information:
The default user password is:locust locust, which can be modified by configuring the environment variable
LOCUST_WEB_AUTHof theLocust_Mastercomponent.
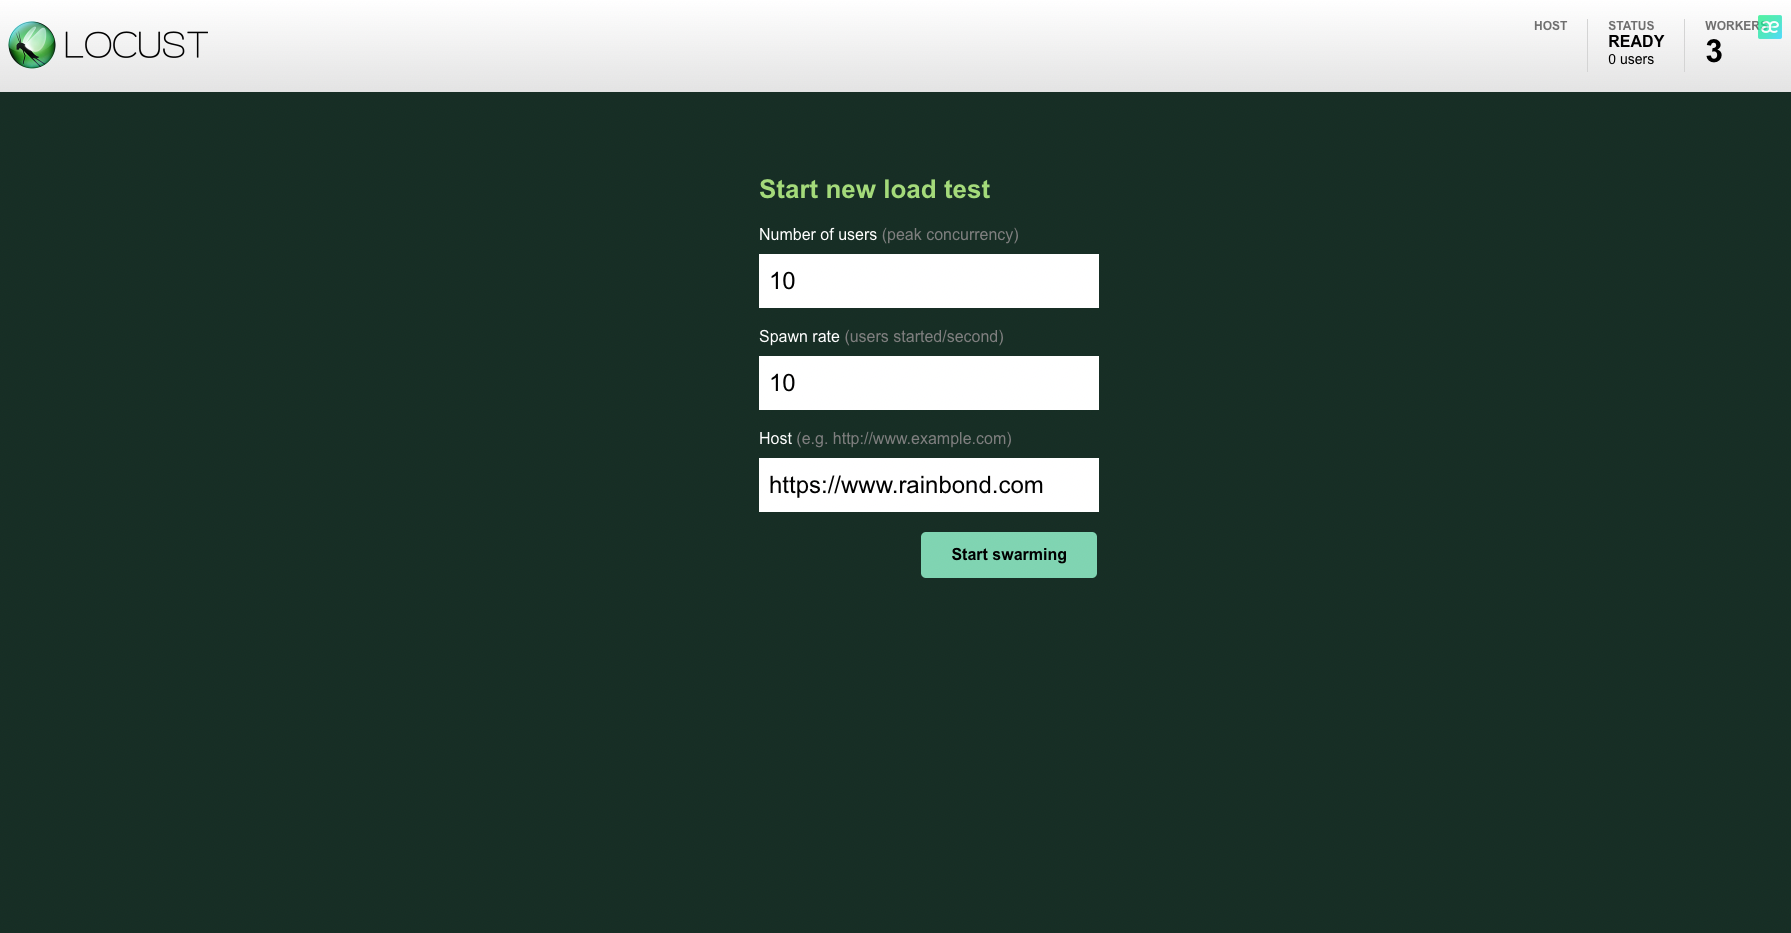
Number of users Fill in the number of simulated concurrent users. After testing, a single slave instance can easily provide the pressure of thousands of concurrent users.
Spawn rate Fill in the hatch rate ofLocusts, that is, how many users are generated per second.
Host Fill in the site address you want to stress test.
After the Host and the user, the concurrency is defined, it is necessary to define the test case, that is, the behavior of the user after accessing the Host. Locust defines the user behavior through a Python script named/locustfile.py On the Rainbond platform Locust_Master components within environment configuration -> configuration file settings for editing modification.

The code example is as:
from locust import HttpUser, task, between

class MyUser(HttpUser):
    wait_time = between(5, 15)

    @task(2)
    def index(self):
        self.client.get("/")

    @ task(1)
    def about(self):
        self.client.get("/docs/")
This script will mimic the following behavior in order:
- Host's `path twice
- Request Host's
/docs/path once - Between each execution of the task, the interval is 5-15 seconds
The reason for this design is that the designers of Locust believe that the real user behavior will not execute all the requests one after another like a script and then exit.In more cases, after the user has done one thing, he will pause for a while, such as reading the instructions and thinking about what to do next.So a blank period of random duration is left between each step.This assumption is actually more in line with the actual user behavior.
This file will be mounted on the locust_master component as a configuration file, and shared with alllocust_slavecomponents.This means that if you want to change the content of this file, you only need to edit the configuration file mounted under the environment configuration in the locust_master component.Then update the entire Locust cluster to take effect.
Result analysis
With the help of the WEB-UI interface provided by Locust, we can easily analyze the stress test results.
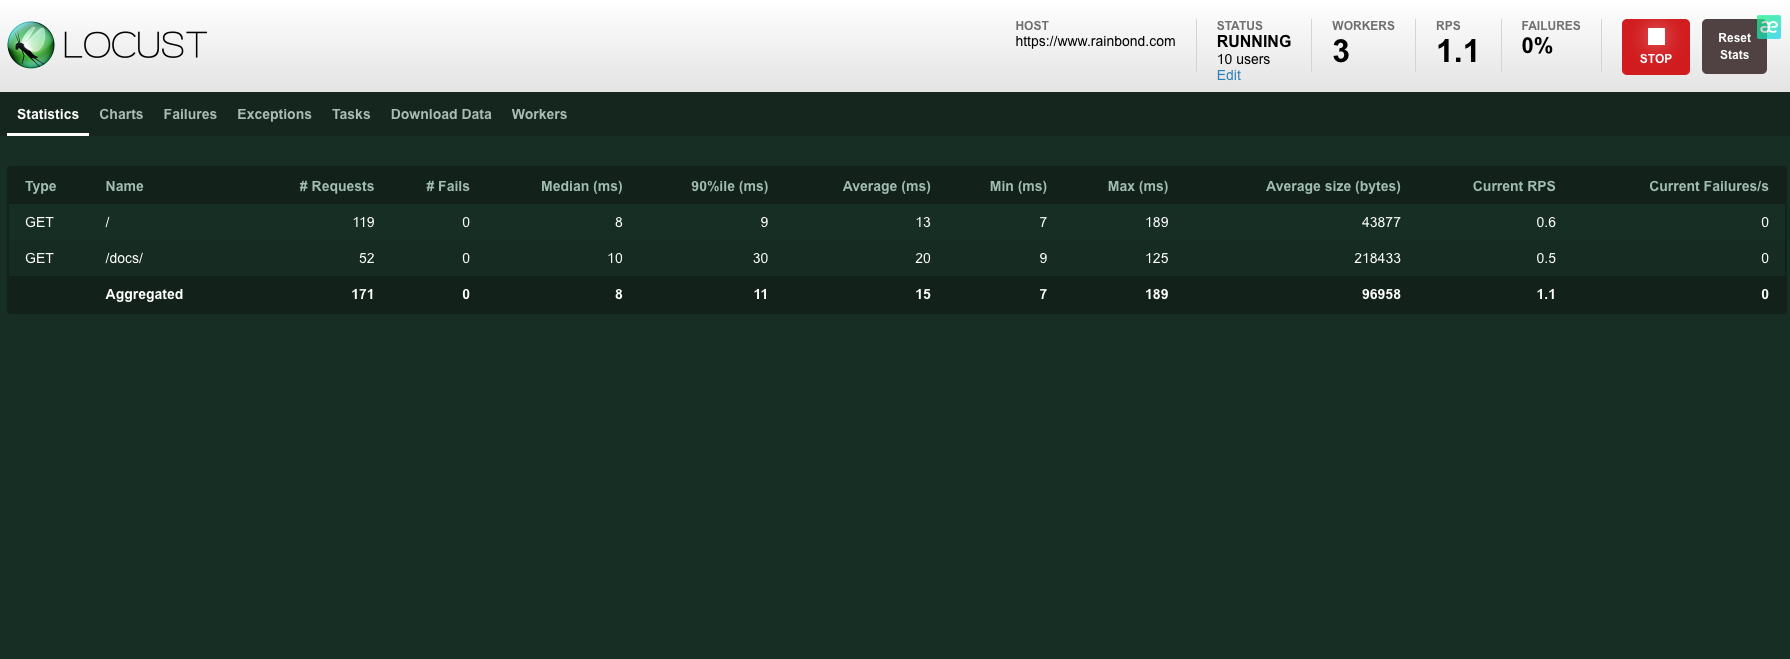
The Statistics page will show us a summary report of all the interfaces under pressure.Results include:
Type Request Type;
Name Request Path;
Requests Total Requests;
Fails Fails;
Median Median Response Time;
90%ile 90% Request response time;
Average Average response time;
Min Minimum response time;
Max Maximum response time;
Average size Average size of requests;
Current PRS Current throughput rate;
Current Failures Current error rate;
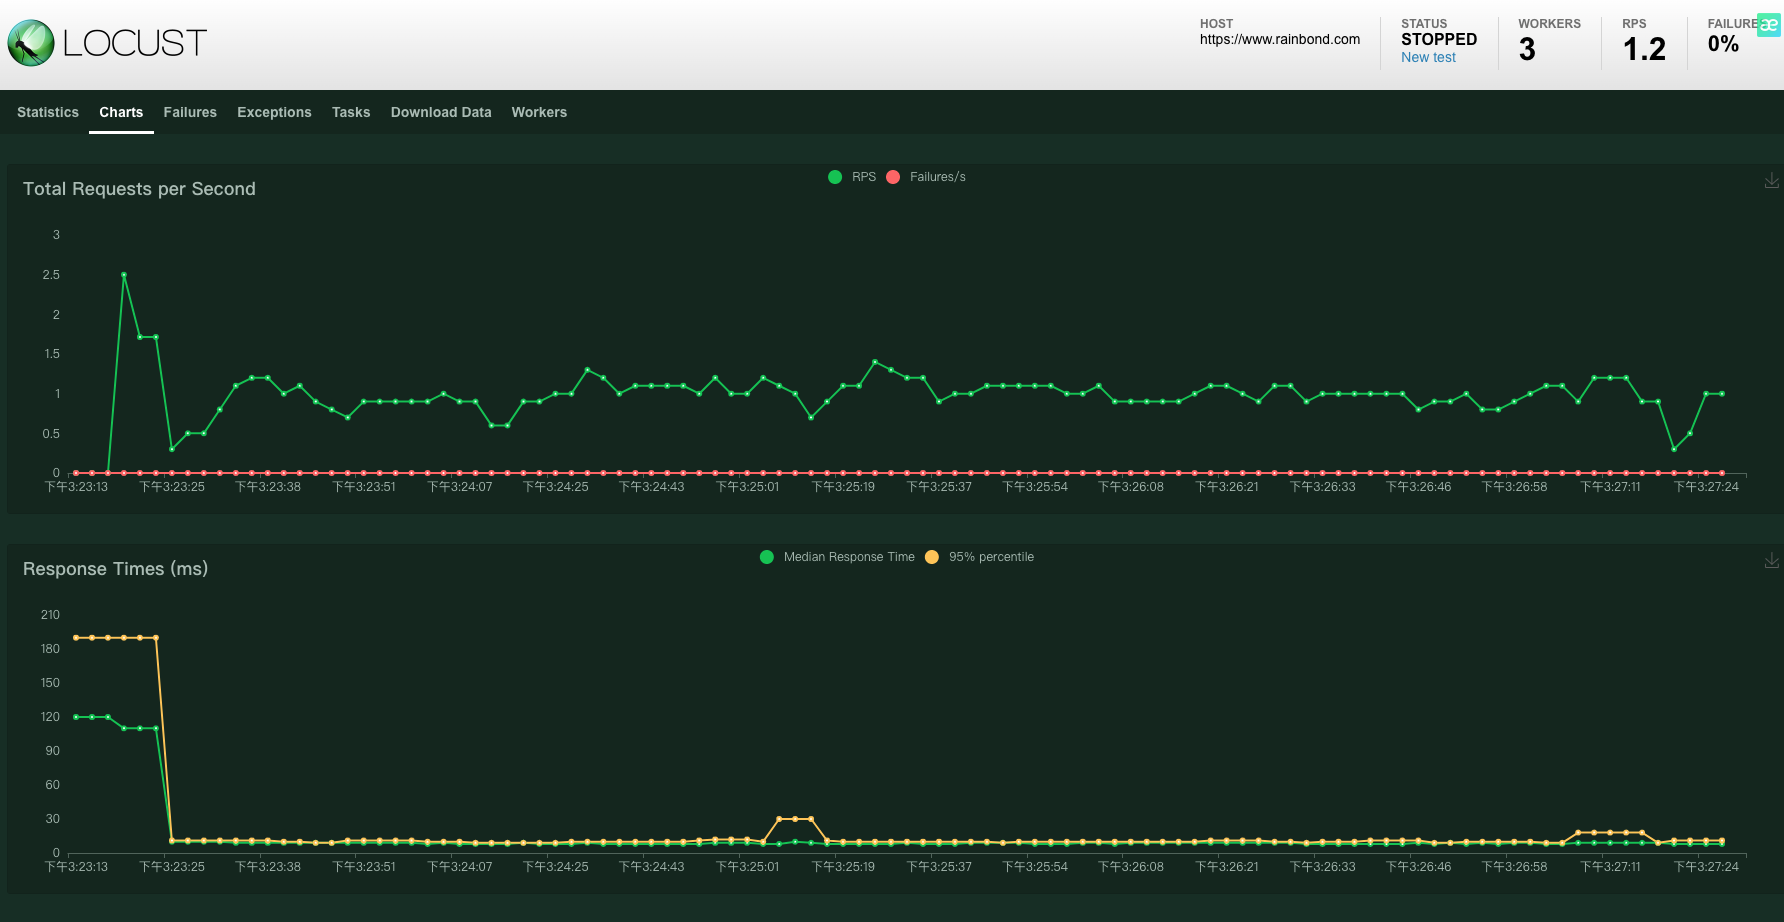
The Charts page plots key results as time-varying charts that guide users on trends.
In addition to these, there are several notable values that will be displayed globally in the top row, including the host domain name of the current request, the number of concurrent users currently generated, the number of slave nodes, the total throughput rate of all currently requested interfaces, errors Rate.and a button to stop the test.
Several other pages will provide:
Failures Request failed interface and failure reason;
Expections Unexpected error in test and error reason
Download Data Download address of test data in csv format
Workers Information of all slave instances
For more tutorials, please refer toLocust official documentation